Welcome to R!
Figure 1
Figure 2
Figure 3
Figure 4
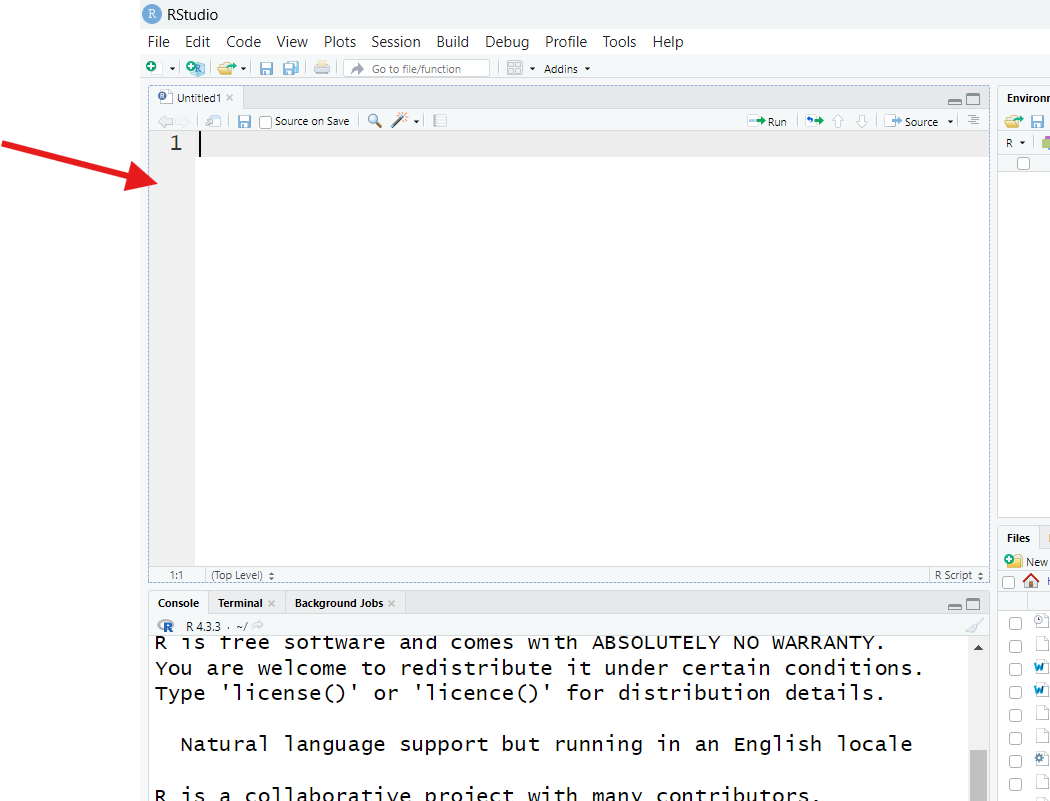
Figure 5
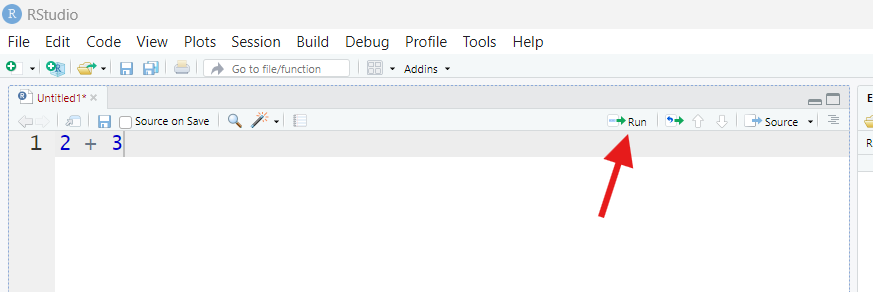
Figure 6
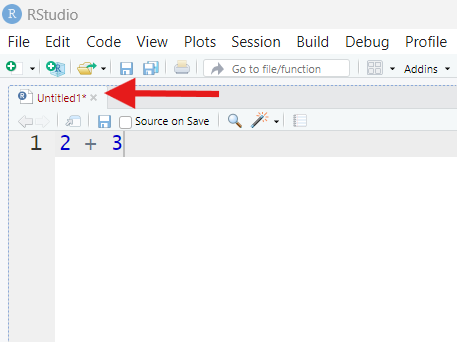
Figure 7
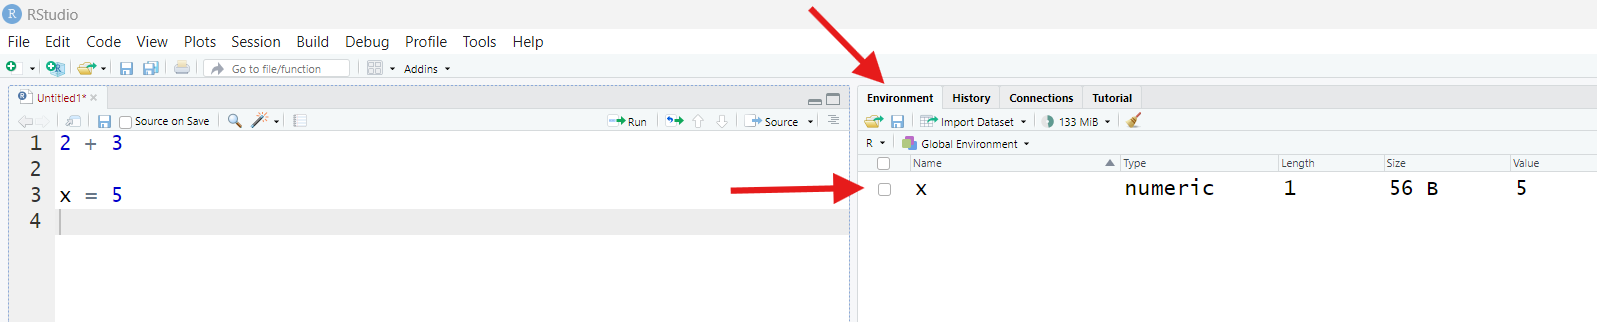
Figure 8
Figure 9
Figure 10
Figure 11
Figure 12
Figure 13
Exploring the Tidyverse, a modern R "dialect"
Figure 1
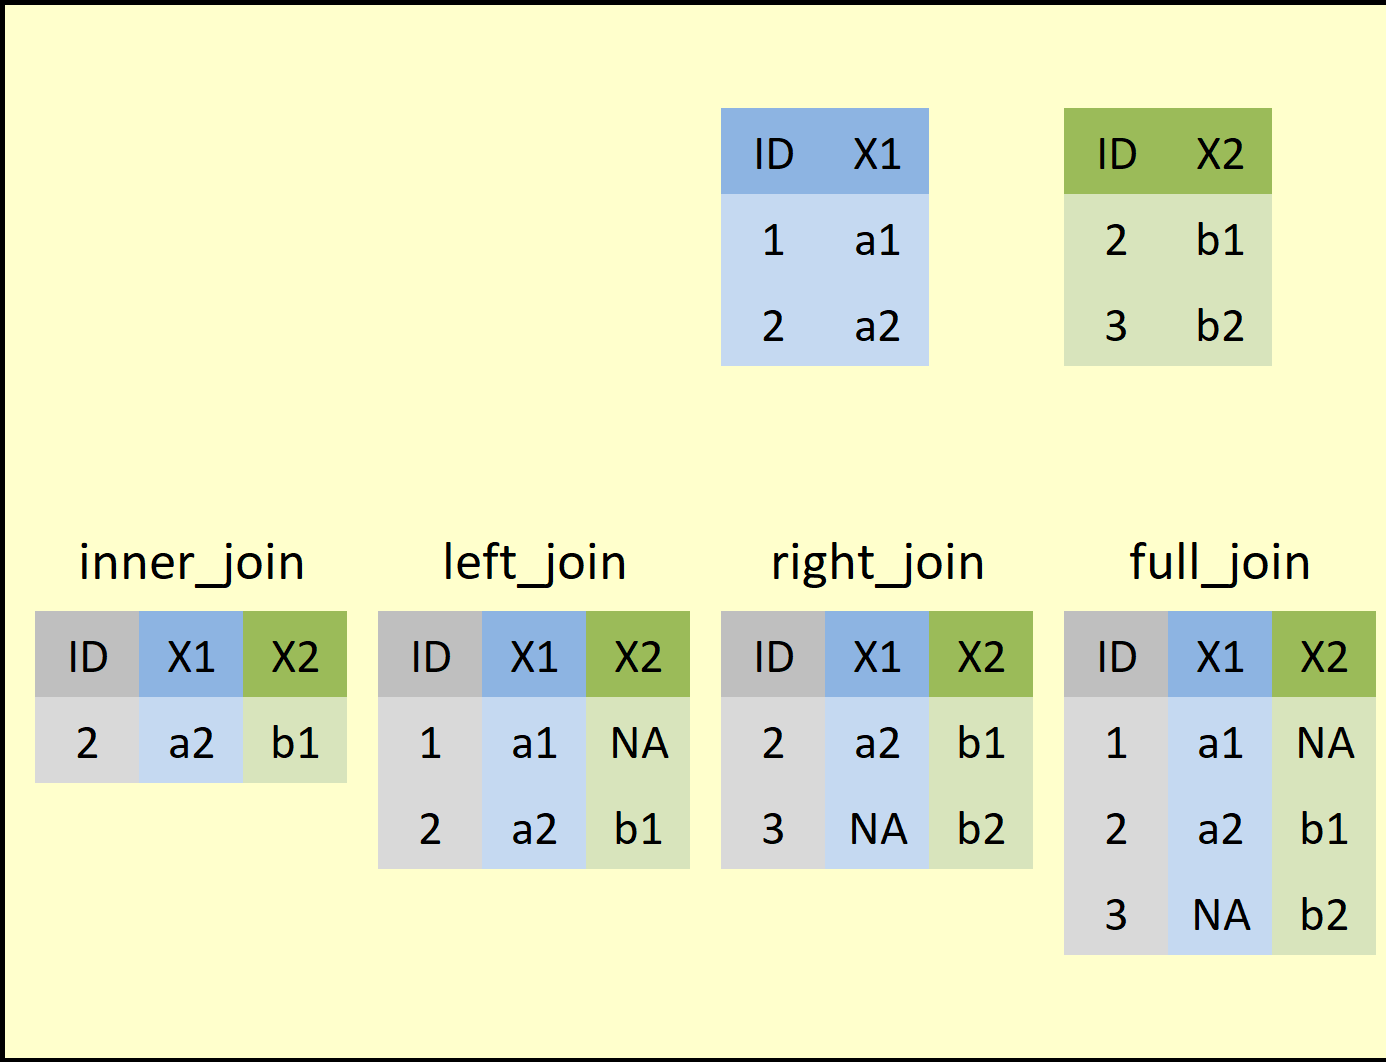
A diagram showing the most common types of
joins. On the top are two small data tables (a “left” table in blue and
a “right” table in green). A left join keeps all the rows in the
left-hand table and adds any matching data to those rows found in the
right-hand table (any missing data implied by the join gets marked as
NAs). A right join does the opposite, keeping only all the rows in the
right-hand table. An inner join will only keep rows that have a match in
both tables, and a full join will keep all rows from either table
whether they had a match or not. A “match” is determined by whether or
not the values in key columns (here, the two ID
columns) match between the left-hand and right-hand tables. In this
example, row 2 of the left table and row 1 of the right table match
because they have the same ID value, so all joins will unite the data in
these two rows in the product.
Figure 2

Figure 3

Figure 4
Figure 5
Figure 6
Figure 7
Figure 8
Figure 9
Figure 10

Figure 11
Figure 12
Figure 13
Figure 14

Figure 15

Figure 16

Figure 17

Figure 18

Figure 19
Figure 20

Figure 21

Figure 22
Figure 23
Figure 24
Figure 25
Figure 26

Figure 27
Figure 28
Figure 29
Figure 30

Figure 31
Figure 32

When data are in a wide format (left-hand side
above), groups within the data (such as teams) have their own rows, and
everything we know about each group (such as stats) is listed in
different columns in that group’s row. When data are in long format
(right-hand side above), each individual row belongs to a single
observation, i.e one datum (such as one particular record of one
statistic) and columns instead hold information about what groups each
statistic belongs to. Same data, different organizations!
Control Flow--if() and for()
Figure 1
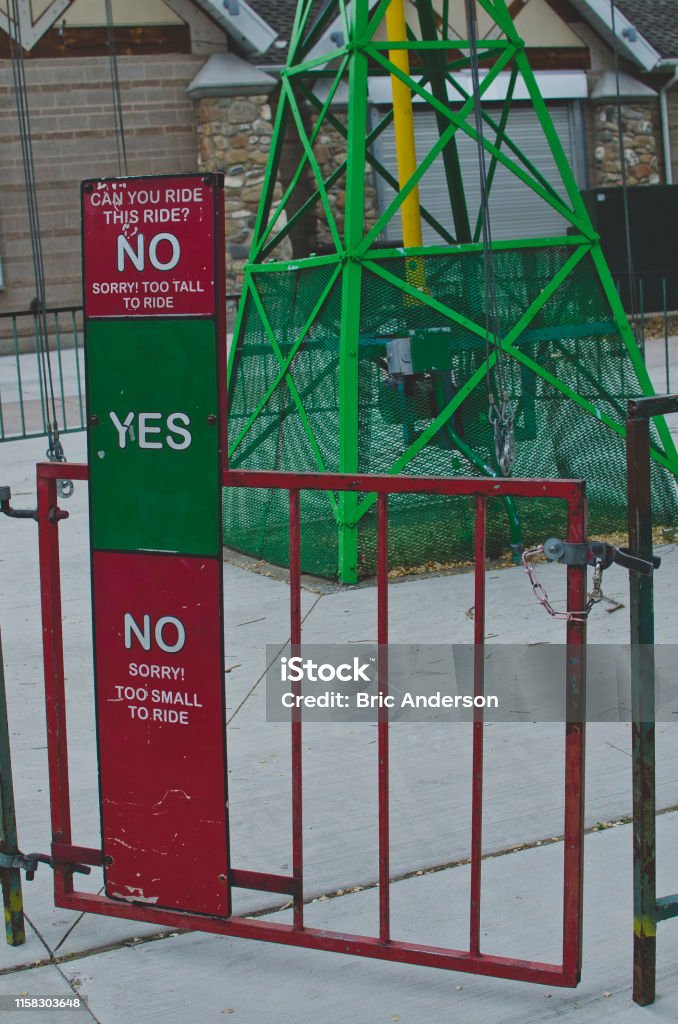
If you’ve been to an amusement park, you’ve
probably seen a sign like this one before. It may not seem like it at
first, but this sign is an “if statement!”
Figure 2
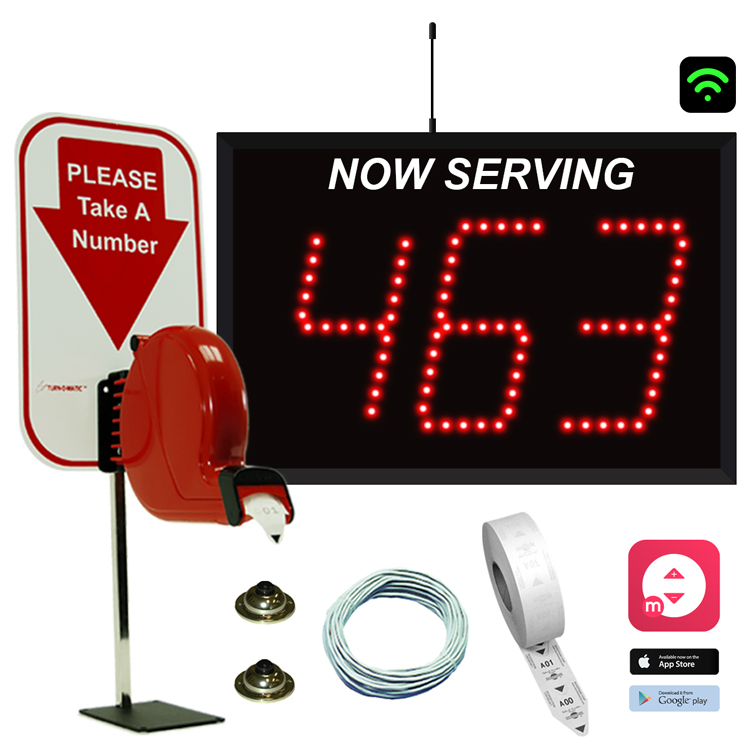
If you’ve ever been to a deli counter or the
DMV, you’ve probably seen a ticket system like this one. This is just a
for loop!
Vectorization
Figure 1
Figure 2